What is Analytical Database?


 5 Minute read

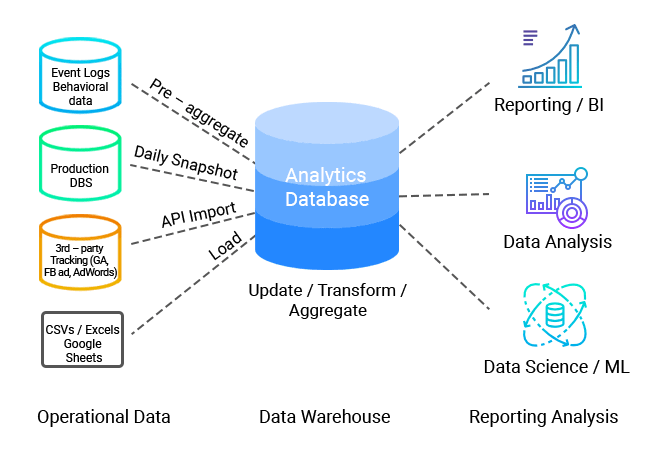
A data management platform that stores and organizes data for the purposes of business intelligence and analytics is known as an analytics database, sometimes known as an analytical database. Analytics databases are read-only platforms with a focus on promptly answering queries and easier scalability. Usually, they are a component of a bigger data warehouse.
Big data management for commercial applications and services is the area of expertise of analytical database software. Advanced analytics and rapid query response times are features of analytical databases that have been optimized. Additionally, they are generally columnar databases that can efficiently write and read data to and from hard disc storage to reduce the time it takes to process a query. They are also more scalable than traditional databases. Column-based storage, in-memory loading of compressed data, and the capacity to search data across various properties are all hallmarks of analytical databases.
Analytical software like SAS, SPSS, SSAS, and R employ specialized databases called analytical databases. These databases are massive in size and extremely complex. These databases are now natively supported in the majority of RDBMS systems on the same platform as the data warehouse. The analytical database queries, whether conducted separately or in the same database, are quite intricate and time-consuming, frequently generating numerous intermediate temporary data structures on-the-fly. This complexity results from the unpredictability of the underlying statistical model. These databases nevertheless share the same storage and network layer as the data warehouse and the data marts even if they are constructed as a different instance. The demand for shared resources grows when a user runs queries on the analytical database.
Use of Analytical database?
- Machine data – The data produced by software and hardware to increase productivity.
- Sensor data – Data gathered over time by sensors that keep an eye on things like the weather.
- Process data – Analysis of processes to identify bottlenecks and gain a better understanding of logistics.
- Market data — Historical price and volume data for financial markets for testing trading strategies.
- Transactional data — Historical transactions that can include purchasing patterns for improved marketing.
- Natural language data — Study of social media posts for research purposes.
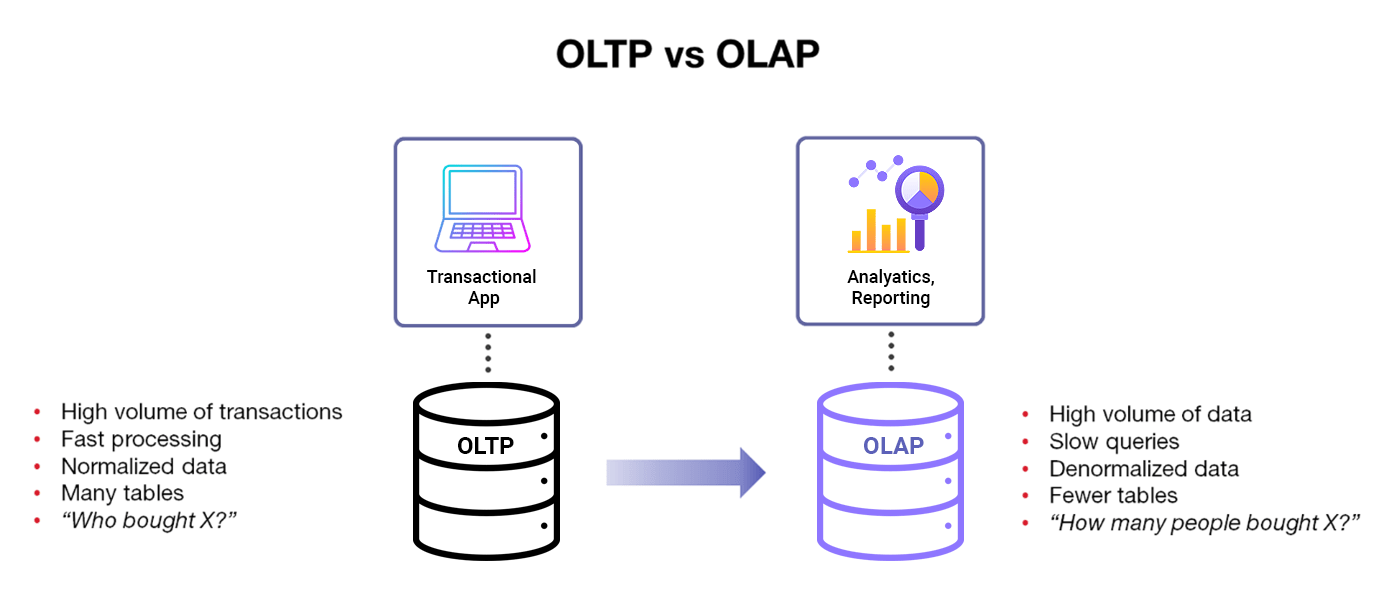
Analytical Database v/s Operational database (RDBMS)
Why we need Analytical Database?
Just in the last several years, data warehouse technology has made considerable advancements. To explicitly meet the needs of businesses looking to create extremely high-performance data warehouses, a whole category known as analytical databases has emerged. In comparison to transactional databases, analytical databases are frequently 100–1,000 times faster at swiftly analyzing extraordinarily huge volumes of data.
A modern analytic database didn't exist until Vertica was established in 2004. The market has since taken off. Technology businesses with venture capital funding have taken the lead, among them Vertica, ParAccel, Greenplum, Teradata, and others. Most of these startups have been purchased by top enterprise technology firms, including HP and Oracle.
Introduction of cloud analytics databases
The landscape of analytic databases was altered by the introduction of cloud computing. A convenient way to acquire and implement technological solutions is through cloud computing. Cloud computing is ideal for cash-strapped, rapidly expanding enterprises since it has no set upfront fees and can spin up more capacity as needed.
The first cloud analytic database, Redshift, was made available by Amazon in 2012. Companies can save capital expenditures and the difficult process of installing, configuring, and maintaining their own hardware because it can be deployed for as little as $100 or so per month and is entirely provided online.
The standard method for delivering analytical databases is now the cloud. Redshift is now the market leader in cloud analytic databases, but major rivals include Snowflake, Google BigQuery, and Microsoft Azure Synapse.
What an analytical database is made of?
- Columnar data storage - An analytical database has a column-based structure, with each data column grouped into a star- or snowflake-shaped schema and saved in its own file. This extremely adaptable design makes it possible to quickly operate on a huge number of data points inside a given column. Instead, row-based data storage is used by transactional databases. Row-based designs are excellent for working rapidly on a single row, but they cannot scale to handle enormous amounts of data in the same way that columnar designs can.
- Efficient data compression - An analytical database can use the most effective type of data compression for each specific column of data thanks to its columnar data storage design. The most crucial factor in determining how much room and time your data will take up and how quickly you can transfer it around is data compression. This is where analytical databases excel.
- Distributed workloads - Your data is kept on a group of servers known as a "node" in a distributed system. For instance, RedShift warehouses organize the simultaneous processing of your analytical queries across all of the servers where your data may be spread over 4 to 18 different servers. Increasingly enormous volumes of data may be processed effectively thanks to this parallelization. Distributed processing is often at the heart of how analytical databases are constructed.
What are the different types of Analytical Databases available in market?
- Columnar databases – which organize data by columns instead of row, reducing the number of data elements that have to be read by the database engine.
- Data warehouse appliances – which combine the database with hardware and business intelligence tools in an integrated platform.
- In-memory databases – which load the source data into system memory in a compressed, non-relational format to streamline the work involved in processing queries.
- Massively parallel processing (MPP) databases – which spread data across a cluster of servers, enabling the systems to share the query processing workload.
- Online analytical processing (OLAP) databases – which store multidimensional “cubes” of aggregated data for analyzing information based on multiple data attributes.

What is OLAP?
Databases for online analytical processing (OLAP) are designed specifically to handle analytical queries. Online transaction-processing (OLTP) databases' analytical queries frequently produce lengthy responses. This is due to several factors.
First off, analytical searches for OLTP databases typically require performing complicated JOIN operations on numerous tables, which can be computationally expensive. Second, whereas read-heavy analytical queries frequently benefit from more indexes, OLTP databases typically have relatively few indexes to maximize write speed. Third, while running lengthy analytical queries, OLTP databases frequently experience contention (primarily for indexes), which slows down both the transactions and the queries.
By offering a distinct, optimized database for analytical queries, OLAP databases address these problems. We'll go over various approaches to optimizing databases for analysis.
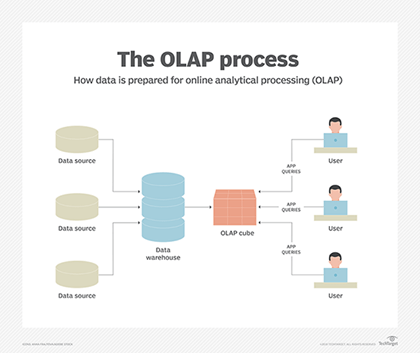
Large-scale multidimensional analysis on data from a data warehouse or data mart can be speed up using OLAP databases. High-speed analysis can be achieved by loading the data to be analyzed into memory, storing the data in columnar order, extracting relational data into a multidimensional format known as an OLAP cube, and/or employing several CPUs concurrently (also known as massively parallel processing, or MPP).
What is ETL and ELT?
Creating a procedure to transfer data from the transactional database to the analysis database is one obstacle to the implementation of OLAP. The process of extracting, transforming, and loading (ETL) the data used to be a nightly batch operation. ETL batch operations were frequently replaced with continuous data streams as hardware and software advanced, and occasionally the transformation step was postponed until after loading (ELT). To assist feature engineering for machine learning using the analysis database, ELT is becoming more widespread.
What is an OLAP cube?
The use of OLAP cubes or hypercubes allows for the speedy performance of analyses without the need for several SQL JOINs and UNIONS. Systems for business intelligence (BI) have been transformed by OLAP cubes. Business analysts used to submit their queries at the end of the day and then leave for the day in hopes of receiving replies the next. The data engineers would perform the overnight cube creation jobs after the OLAP cubes so that the analysts could run interactive queries against the cubes the following morning.
The five different "slice and dice" operations supported by OLAP cubes. Slice refers to the process of removing a lower-dimensional cube from which one dimension has been set to a single number, such as MONTH=6. In dicing, a sub-cube with multiple dimensions all set to a single value, such as STORE=95 AND MONTH=6, is extracted. By drilling up and down, an analyst can switch between summaries (up) and detailed values (down). Data is rolled up or compiled along a dimension. In order to view the data from a different angle, Pivot rotates a cube. Pivoting in an OLAP cube is far more effective than pivoting in a spreadsheet. OLAP cubes can be queried using the SQL-like MDX query language.
In recent years, data warehouses that employ compressed columnar storage (ideally in-memory) and MPP have essentially supplanted OLAP cubes.
What is MOLAP?
What is ROLAP?
OLAP cubes are not necessary for relational OLAP (ROLAP), which works directly with relational databases. Typically, the OLTP database and the analytical database for ROLAP are separate, and an ETL or ELT process updates the data warehouse or data mart from the OLTP database on a regular basis while also producing aggregate tables. Instead of starting from beginning to create the data warehouse, the ETL or ELT procedure typically works with incremental data to increase efficiency.
Analysts query a ROLAP database with SQL instead of MDX queries, frequently depending significantly on the more recent analysis operators. A given column is used to group aggregates in the GROUP BY clause. By extending GROUP BY to many columns, the ROLLUP operator essentially computes subtotals and grand totals. When using the CUBE operator, subtotals and grand totals are calculated for every combination of the chosen columns.
What is HOLAP?
ROLAP and MOLAP are combined in hybrid online analytical processing (HOLAP). With HOLAP, you can store some of the data in a MOLAP store and some of it in a ROLAP store. Aggregates from both the relational database and the cube are often stored in a cache. HOLAP is implemented using SAP BI Accelerator and Microsoft Analysis Services.
As we've shown, business intelligence searches can be sped up using specialized analytical databases. While OLAP cubes dominated the market for many years, relational databases with compressed columnar storage and highly parallel processing are now more frequently used by businesses to run data warehouses.
What are the benefits of Big Data Analysis or having Analytical Databases?
Top 10 industries utilizing big data analytics
Some Analytical Databases are available in market
-
Traditional Analytics Databases -These are the canonical names in the previous generation of big data analytics and are still widely deployed and in many cases regarded as the gold standard in various ways.
- HP Vertica
- Pivotal Greenplum
- Teradata
- Paraccel / Actian
- Netezza
- SAP IQ
-
Open-Source Analytics Databases -For one reason or another, it is difficult to classify these databases into other categories, although they are all open sources. Most databases in other categories are likewise open source (take note of this).
- MariaDB ColumnStore (formerly InfiniDB)
- Clickhouse
- LocustDB
-
GPU-Accelerated Databases -GPUs are leading the way in the development of hardware-accelerated databases, which accelerate analytical tasks.
- MapD
- SQream
- BrytlytDB
- BlazingDB
-
Hadoop/Big Data Ecosystem -Numerous databases created for analytics and business intelligence workloads are part of the "big data" ecosystem. These can be thought of as access layers atop huge datasets that are stored in distributed filesystems, particularly columnar storage patterns like Parquet and Arrow. While others are closer to the raw bytes, like Presto, which functions more as a query engine than a database.
- HBase
- Presto
- Kudu
- Druid
- Spark
- Amazon Athena
- Parquet
- Arrow
- Actian Vector
-
NoSQL and Multi-Model Analytics Databases -Although most NoSQL databases don't exactly fit the analytics category, some are nonetheless utilized for analytics.
- MongoDB
- ScyllaDB
- ElasticSearch
- Cassandra
- Couchbase
- Aerospike
- FaunaDB
- CrateDB
-
Time Series Databases -With some restrictions on the sophistication of queries and use cases, time series is frequently a simpler example of full-fledged analytics.
- InfluxDB
- TimescaleDB
- IRONdb
- Prometheus
- kdb+
-
Cloud based Analytical Databases
- Google BigQuery
- Amazon Redshift
- Azure SQL Data Warehouse
- Snowflake
- SAP HANA
- New Relic Insights
-
Custom-Built Analytics and Event Databases -Since there was no existing platform that was well suited for their needs, several monitoring, analytics, and security organizations have constructed at least a portion of their own platforms from scratch. Here are a few of them, with varied degrees of specificity.
- Honeycomb
- Kentik
- Segment
- Heap
- Interana
- Mode
- Facebook SCUBA
- VividCortex
- Datadog